Italy · Detailed regional profile
Tuscany
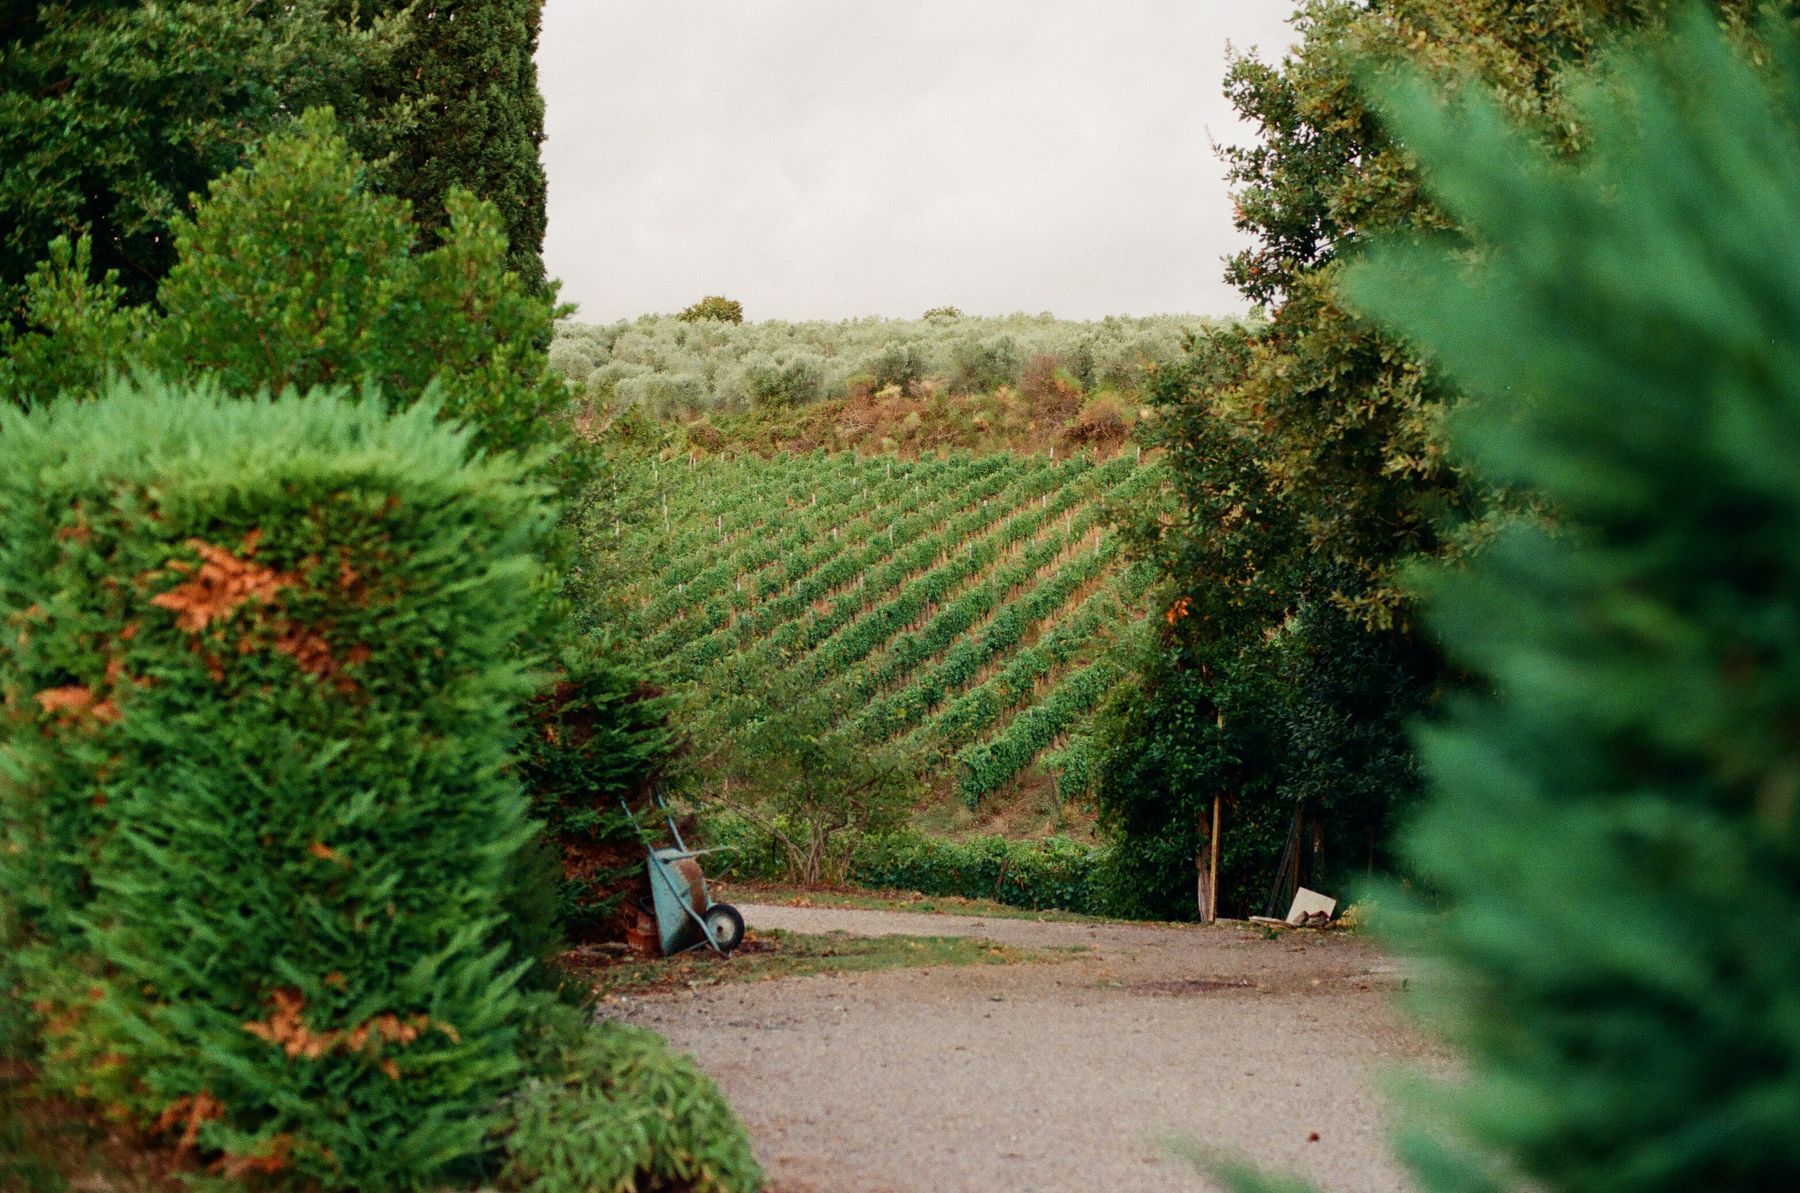
Sign in to followA varied central Italian region best known for Sangiovese, with Bordeaux varieties also grown near the coast.
Elevation and distance from the sea separate the warmer, drier interior from the coast. Autumn rain adds another important difference.
Climate comparisons use the 1991–2020 combined regional record · updated through Sep 13, 2026.
Current conditions
Observations through Oct 30, 2026 · 06:00 UTC
Temperature7.0°C
Dew Point5.9°C
Relative Humidity92%
24h Rainfall0.0 mmmodeled IFS total through Oct 29
Vintage explorer
Compare this vintage · View 2001 across regions →
Mean temperature18.7°C
Temperature anomaly-0.3°Cvs 1991-2020
Growing degree days1876base 10°C
Hot days0≥ 35°C
What stood out in 2001
No single weather pattern stands out in the regional record.
Close to the usual range · Low confidence
Temperature, rainfall, heat, and frost all stayed within the site's published thresholds.
No single weather pattern stands out in the regional record.
How unusual was 2001?
The ranking compares vintages that meet the data-coverage threshold and use the same source, regional rules, and 1991-2020 baseline.
Growing-season temperature
10th coolest of 35 vintages Cooler than 24 of 34 other vintages 18.7°CGrowing-season rainfall
11th driest of 35 vintages Drier than 24 of 34 other vintages 419.3 mmHeat accumulation
12th lowest of 35 vintages Lower than 23 of 34 other vintages 1876 GDDHot days
8th most of 35 vintages More than 0 of 34 other vintages 0 days2001 month by month
Compared with 1991–2020
Follow heat accumulation, rainfall, frost exposure, and the region’s growing and harvest windows in calendar order.
Frost watch
Growing season
Harvest window
-
1–31 Frost watchHeat accumulation
2001 0 GDDTypical 26 GDDRainfall
2001 109.7 mmTypical 65.6 mm- 2001 freezing days
- 0
- Typical
- 1.3
Heat accumulation ran behind the typical month.
-
1–30 Frost watchGrowing seasonHeat accumulation
2001 49 GDDTypical 84 GDDRainfall
2001 78.9 mmTypical 74.4 mm- 2001 freezing days
- 0
- Typical
- 0.2
Heat accumulation ran behind the typical month.
-
1–31 Frost watchGrowing seasonHeat accumulation
2001 242 GDDTypical 208 GDDRainfall
2001 99.0 mmTypical 68.5 mm- 2001 freezing days
- 0
- Typical
- 0.0
Wetter than the typical month.
-
1–30 Growing seasonHeat accumulation
2001 307 GDDTypical 325 GDDRainfall
2001 15.2 mmTypical 46.0 mmDrier than the typical month.
-
1–31 Growing seasonHeat accumulation
2001 404 GDDTypical 423 GDDRainfall
2001 37.8 mmTypical 29.9 mmClose to the typical monthly pattern.
-
1–31 Growing seasonHarvest windowHeat accumulation
2001 442 GDDTypical 431 GDDRainfall
2001 7.8 mmTypical 39.2 mmDrier than the typical month.
-
1–30 Growing seasonHarvest windowHeat accumulation
2001 213 GDDTypical 289 GDDRainfall
2001 128.8 mmTypical 92.6 mmHeat accumulation ran behind the typical month.
-
1–31 Growing seasonHarvest windowHeat accumulation
2001 217 GDDTypical 170 GDDRainfall
2001 53.1 mmTypical 114.1 mmHeat accumulation ran ahead of the typical month.
View milestone calendar data as a table
| Month | 2001 GDD | Typical GDD | 2001 rainfall | Typical rainfall | 2001 freezing days | Typical freezing days |
|---|---|---|---|---|---|---|
| March 2001 | 0 GDD | 26 GDD | 109.7 mm | 65.6 mm | 0 | 1.3 |
| April 2001 | 49 GDD | 84 GDD | 78.9 mm | 74.4 mm | 0 | 0.2 |
| May 2001 | 242 GDD | 208 GDD | 99.0 mm | 68.5 mm | 0 | 0.0 |
| June 2001 | 307 GDD | 325 GDD | 15.2 mm | 46.0 mm | Outside frost window | Outside frost window |
| July 2001 | 404 GDD | 423 GDD | 37.8 mm | 29.9 mm | Outside frost window | Outside frost window |
| August 2001 | 442 GDD | 431 GDD | 7.8 mm | 39.2 mm | Outside frost window | Outside frost window |
| September 2001 | 213 GDD | 289 GDD | 128.8 mm | 92.6 mm | Outside frost window | Outside frost window |
| October 2001 | 217 GDD | 170 GDD | 53.1 mm | 114.1 mm | Outside frost window | Outside frost window |
Calendar data and method
Monthly values are weighted across every configured regional sample using stored Google ARCO ERA5 daily reanalysis. “Typical” is the mean monthly total across 30 baseline seasons. GDD is counted only inside the configured growing window; freezing days are counted only inside the frost-watch window; rainfall covers every displayed calendar day.
Selected-vintage coverage is 100%. Source rows were last retrieved Sep 13, 2026.
Replay the 2001 growing season
214 daily regional observations
Move through the season to follow temperature, rainfall, accumulated heat, and recorded weather events day by day.
Mean temperature
Daily rainfall
Season GDD
Season rainfall
No detected event on this date.
Replay data and method
Daily values are weighted across every configured regional sample using stored Google ARCO ERA5 reanalysis. Coverage is 100%. Source rows were last retrieved Aug 20, 2026.
Closest weather matches
These years had the most similar growing-season and harvest weather.
Closest match
2008
Most alike in Hot-day count and Growing-season mean temperature.
- Hot-day count
- the same: 0 days
- Growing-season mean temperature
- the same: 0.0°C
Largest difference: Harvest precipitation — less rain
View 2008 →Second closest
1994
Most alike in Hot-day count and Spring frost exposure.
- Hot-day count
- the same: 0 days
- Spring frost exposure
- the same: 0 days
Largest difference: Growing degree days — higher
View 1994 →Third closest
2007
Most alike in Hot-day count and Spring frost exposure.
- Hot-day count
- the same: 0 days
- Spring frost exposure
- the same: 0 days
Largest difference: Growing-season precipitation — less rain
View 2007 →
How similar years are calculated
Method analog-v1-2026-07 standardizes six weather measures across 34 complete ARCO ERA5 comparison years, then measures the distance between them. The calculation runs when the page is requested.
Measures used: Growing-season mean temperature (20%); Growing degree days (15%); Hot-day count (15%); Growing-season precipitation (20%); Harvest precipitation (20%); Spring frost exposure (10%).
Calculated distances: 2008 0.095; 1994 0.140; 2007 0.374.
View historical chart data as a table
| Year | Temperature anomaly | Rainfall anomaly | Hot days |
|---|---|---|---|
| 1991 | -1.5°C | +232 mm | 0 |
| 1992 | -0.7°C | +202 mm | 0 |
| 1993 | -0.4°C | +72 mm | 0 |
| 1994 | -0.1°C | -41 mm | 0 |
| 1995 | -1.2°C | -19 mm | 0 |
| 1996 | -1.2°C | +123 mm | 0 |
| 1997 | -0.7°C | -62 mm | 0 |
| 1998 | -0.0°C | +17 mm | 0 |
| 1999 | +0.4°C | +21 mm | 0 |
| 2000 | +0.2°C | -12 mm | 0 |
| 2001 | -0.3°C | -46 mm | 0 |
| 2002 | -0.4°C | +152 mm | 0 |
| 2003 | +1.4°C | -150 mm | 4 |
| 2004 | -0.2°C | -2 mm | 0 |
| 2005 | -0.3°C | -59 mm | 0 |
| 2006 | +0.2°C | -102 mm | 0 |
| 2007 | -0.2°C | -123 mm | 0 |
| 2008 | -0.3°C | -39 mm | 0 |
| 2009 | +0.6°C | -78 mm | 0 |
| 2010 | -0.5°C | +127 mm | 0 |
| 2011 | +0.6°C | -225 mm | 0 |
| 2012 | +0.8°C | +10 mm | 0 |
| 2013 | +0.3°C | -16 mm | 0 |
| 2014 | -0.2°C | +54 mm | 0 |
| 2015 | +0.7°C | +26 mm | 0 |
| 2016 | +0.3°C | +9 mm | 0 |
| 2017 | +0.7°C | -179 mm | 5 |
| 2018 | +1.3°C | -25 mm | 0 |
| 2019 | +0.7°C | +56 mm | 0 |
| 2020 | +0.5°C | +48 mm | 0 |
| 2021 | +0.2°C | -152 mm | 1 |
| 2022 | +1.5°C | -114 mm | 1 |
| 2023 | +1.5°C | +29 mm | 3 |
| 2024 | +1.1°C | +171 mm | 4 |
| 2025 | +0.8°C | -6 mm | 7 |
| 2026 | +3.5°C | -214 mm | 23 |
winter
7.7°C
+1.3°C vs baseline
269 mm rain · +52 mm
spring
13.8°C
+0.9°C vs baseline
286 mm rain · +78 mm
summer
22.5°C
-0.3°C vs baseline
60 mm rain · -55 mm
harvest
18.7°C
-0.1°C vs baseline
187 mm rain · -44 mm
Weather events
Periods that crossed one of the published regional thresholds, shown in date order.
Dry spell
- Duration
- 14 days
- Total rain
- 2.6 mm
- Daily cutoff
- 1.0 mm/day
Dry spell
- Duration
- 20 days
- Total rain
- 2.4 mm
- Daily cutoff
- 1.0 mm/day
Dry spell
- Duration
- 21 days
- Total rain
- 1.8 mm
- Daily cutoff
- 1.0 mm/day
Concentrated harvest rain
- Total rain
- 66.0 mm
- Highest 3-day total
- 66.0 mm
- Trigger threshold
- 38.8 mm
A large share of the season's rain fell during the harvest period.
How events are detected
Weather & Vines combined regional series; method event-timeline-v2-2026-07, rules tuscany-v4-2026-08. Source last updated Aug 20, 2026, calculated Sep 21, 2026. Each configured point must have at least 95.0% coverage.
1991–present
Climate change
Measured regional trends are shown separately from model projections. The observed record ends at the latest complete growing season shared by every published region.
Observed record
Historical trends, 1991–2025
Growing degree days changed +112.6 GDD per decade. The 95% interval is +87.5 to +137.7 GDD per decade, based on 35 eligible vintages.
Weighted median: 70% SSP2-4.5 · 15% SSP1-2.6 · 15% SSP3-7.0
Shaded central 80% model range using the same weights.
How it is measured: Across the April 1–October 31 growing season, each day's mean temperature above 10°C adds to the total; cooler days add zero.
Scroll horizontally to inspect the full timeline.
View annual growing degree days data
| Vintage | Growing degree days | Change from 1991–2020 |
|---|---|---|
| 1991 | 1648 GDD | -283 GDD |
| 1992 | 1781 GDD | -149 GDD |
| 1993 | 1850 GDD | -80 GDD |
| 1994 | 1914 GDD | -16 GDD |
| 1995 | 1678 GDD | -253 GDD |
| 1996 | 1668 GDD | -262 GDD |
| 1997 | 1814 GDD | -117 GDD |
| 1998 | 1916 GDD | -15 GDD |
| 1999 | 2011 GDD | +81 GDD |
| 2000 | 1972 GDD | +41 GDD |
| 2001 | 1873 GDD | -57 GDD |
| 2002 | 1842 GDD | -88 GDD |
| 2003 | 2241 GDD | +311 GDD |
| 2004 | 1888 GDD | -43 GDD |
| 2005 | 1854 GDD | -76 GDD |
| 2006 | 1974 GDD | +43 GDD |
| 2007 | 1882 GDD | -48 GDD |
| 2008 | 1861 GDD | -70 GDD |
| 2009 | 2053 GDD | +123 GDD |
| 2010 | 1814 GDD | -116 GDD |
| 2011 | 2040 GDD | +109 GDD |
| 2012 | 2089 GDD | +159 GDD |
| 2013 | 1990 GDD | +60 GDD |
| 2014 | 1865 GDD | -65 GDD |
| 2015 | 2079 GDD | +148 GDD |
| 2016 | 1974 GDD | +43 GDD |
| 2017 | 2065 GDD | +135 GDD |
| 2018 | 2188 GDD | +258 GDD |
| 2019 | 2065 GDD | +135 GDD |
| 2020 | 2023 GDD | +92 GDD |
| 2021 | 1974 GDD | +43 GDD |
| 2022 | 2260 GDD | +330 GDD |
| 2023 | 2246 GDD | +316 GDD |
| 2024 | 2165 GDD | +235 GDD |
| 2025 | 2098 GDD | +168 GDD |
- Growing-season mean temperature
- +0.54 °C per decade 95% interval +0.42 to +0.67
- Growing degree days
- +112.59 GDD per decade 95% interval +87.48 to +137.70
- Growing-season precipitation
- -25.24 mm per decade 95% interval -63.70 to +13.21
- Hot days
- +0.80 days per decade 95% interval +0.10 to +1.50
- Spring frost days
- -0.39 days per decade 95% interval -0.95 to +0.16
- Longest dry spell
- -1.63 days per decade 95% interval -4.43 to +1.16
Last Updated August 20, 2026
Model ensemble
Projected climate through 2075
Temperature changes are relative to each model’s 1991–2020 baseline. The table combines all three pathways, weighted 70% to SSP2-4.5 and 15% each to SSP1-2.6 and SSP3-7.0.
Scroll horizontally to compare all columns.
| Period | Weighted median | Weighted central 80% | Models per pathway |
|---|---|---|---|
| 2021-2040 | +1.2°C | +0.8 to +1.6°C | 25 |
| 2041-2060 | +1.8°C | +1.3 to +2.7°C | 25 |
| 2061-2075 | +2.3°C | +1.7 to +3.4°C | 25 |
How pathways are combined
For each period and percentile, Weather & Vines takes 70% of the SSP2-4.5 value, 15% of the SSP1-2.6 value, and 15% of the SSP3-7.0 value. Each pathway contains the same 25 models. The weights are an editorial view of the current trajectory, not scenario probabilities.
Last Updated June 29, 2025
Typical year · 1991–2020
When to visit
This calendar describes typical regional weather under the selected climate baseline. It is not a forecast for a future trip, and it does not account for crowds, lodging, events, or vineyard access.
Deterministic IFS forecast
Next ten days
Scroll horizontally to see all forecast dates.
| Date | Fri | Sat | Sun | Mon | Tue | Wed | Thu | Fri | Sat | Sun |
|---|---|---|---|---|---|---|---|---|---|---|
| High | 18°C | 17°C | 12°C | 12°C | 15°C | 15°C | 15°C | 14°C | 12°C | 15°C |
| Low | 7°C | 6°C | 5°C | 6°C | 6°C | 5°C | 6°C | 5°C | 5°C | 5°C |
| Rain | 0.0 mm | 0.0 mm | 0.0 mm | 0.0 mm | 0.0 mm | 0.0 mm | 0.0 mm | 0.0 mm | 0.5 mm | 0.0 mm |
Across the typical year: Late July has the warmest median afternoon high (29.7°C); Late January has the coolest (9.4°C). Wet days are most frequent in Early November (48%) and least frequent in Late July (14%). Ties are resolved by calendar order.
Afternoon highOvernight lowMiddle 50%
Scroll horizontally to inspect all 24 half-month periods.
Scroll horizontally to inspect all 24 half-month periods.
View all 24 periods as a table
Scroll horizontally to view all columns.
| Period | Afternoon high, median (middle 50%) | Overnight low, median (middle 50%) | Wet-day frequency | Period rain, median (middle 50%) |
|---|---|---|---|---|
| Jan 1–15 | 10.0°C (7.8–11.6°C) | 3.0°C (0.5–5.6°C) | 30% | 24.5 mm (11.3–43.9 mm) |
| Jan 16–31 | 9.4°C (7.3–10.9°C) | 2.1°C (-0.1–4.8°C) | 32% | 29.6 mm (15.5–39.6 mm) |
| Feb 1–15 | 10.7°C (8.3–12.3°C) | 2.4°C (0.1–5.1°C) | 32% | 34.2 mm (14.6–55.6 mm) |
| Feb 16–29 | 11.6°C (9.4–13.3°C) | 3.2°C (0.7–5.4°C) | 35% | 28.2 mm (9.9–46.2 mm) |
| Mar 1–15 | 13.5°C (11.4–15.1°C) | 4.6°C (2.6–6.9°C) | 32% | 31.1 mm (15.0–48.5 mm) |
| Mar 16–31 | 15.2°C (12.7–16.7°C) | 5.9°C (3.8–7.9°C) | 31% | 26.4 mm (17.1–50.3 mm) |
| Apr 1–15 | 16.0°C (14.1–18.1°C) | 7.4°C (5.8–9.1°C) | 38% | 37.9 mm (14.7–58.4 mm) |
| Apr 16–30 | 18.1°C (15.9–20.2°C) | 9.3°C (7.4–10.7°C) | 42% | 36.7 mm (27.4–50.5 mm) |
| May 1–15 | 20.4°C (18.6–22.2°C) | 11.3°C (9.8–12.8°C) | 40% | 25.9 mm (16.2–60.2 mm) |
| May 16–31 | 22.5°C (20.1–24.6°C) | 12.9°C (11.3–14.4°C) | 28% | 22.8 mm (14.4–36.2 mm) |
| Jun 1–15 | 24.4°C (22.2–26.5°C) | 15.1°C (13.6–16.8°C) | 32% | 27.1 mm (12.0–44.5 mm) |
| Jun 16–30 | 27.2°C (24.9–29.4°C) | 16.9°C (15.2–18.5°C) | 17% | 10.2 mm (4.0–23.6 mm) |
| Jul 1–15 | 28.7°C (26.5–30.2°C) | 18.5°C (16.8–19.6°C) | 15% | 8.7 mm (3.6–11.7 mm) |
| Jul 16–31 | 29.7°C (27.7–31.1°C) | 18.8°C (17.5–20.1°C) | 14% | 10.2 mm (3.8–21.3 mm) |
| Aug 1–15 | 29.6°C (28.0–31.3°C) | 19.0°C (17.8–20.3°C) | 18% | 9.7 mm (4.8–20.4 mm) |
| Aug 16–31 | 29.0°C (27.0–30.6°C) | 18.4°C (16.9–19.6°C) | 21% | 18.0 mm (5.4–35.0 mm) |
| Sep 1–15 | 25.8°C (23.8–27.7°C) | 16.0°C (14.4–17.4°C) | 29% | 33.8 mm (20.8–48.8 mm) |
| Sep 16–30 | 23.3°C (21.1–25.1°C) | 14.0°C (11.9–16.1°C) | 34% | 53.8 mm (35.0–75.7 mm) |
| Oct 1–15 | 20.8°C (19.0–22.5°C) | 12.6°C (10.7–14.6°C) | 41% | 42.9 mm (23.8–89.3 mm) |
| Oct 16–31 | 18.2°C (16.7–20.1°C) | 10.3°C (8.2–13.1°C) | 38% | 56.6 mm (38.5–71.8 mm) |
| Nov 1–15 | 15.8°C (13.9–17.3°C) | 9.1°C (6.4–11.2°C) | 48% | 67.8 mm (40.8–84.3 mm) |
| Nov 16–30 | 12.6°C (10.3–14.4°C) | 6.2°C (2.7–8.8°C) | 44% | 51.5 mm (25.7–89.7 mm) |
| Dec 1–15 | 10.9°C (9.2–12.7°C) | 4.0°C (1.6–6.7°C) | 41% | 40.5 mm (24.8–58.8 mm) |
| Dec 16–31 | 9.5°C (7.5–11.4°C) | 2.8°C (0.4–5.7°C) | 37% | 33.8 mm (21.9–61.5 mm) |
Each year contributes to temperature or rain separately when at least 90% of that period’s days are present. A value is shown only when at least 80% of the baseline years qualify. February 29 is included in late February.
Historical climatology Last Updated August 20, 2026
Season to date
Growing season heat and rainfall
Apr 1–Oct 29, 2026
Growing degree days2419.3base 10°C
Growing-season rainfall316.0 mmweighted regional total
2026 season1991–2020 average
2026 season1991–2020 average
View growing-season accumulation data
| Date | Season GDD | 1991–2020 average GDD | Season rainfall | 1991–2020 average rainfall |
|---|---|---|---|---|
| 2026-04-01 | 0.0 | 1.7 | 1.0 mm | 1.8 mm |
| 2026-04-02 | 1.0 | 3.4 | 1.1 mm | 4.8 mm |
| 2026-04-03 | 5.3 | 5.4 | 1.2 mm | 6.4 mm |
| 2026-04-04 | 9.9 | 7.3 | 1.2 mm | 10.4 mm |
| 2026-04-05 | 15.5 | 9.3 | 1.2 mm | 13.8 mm |
| 2026-04-06 | 20.2 | 11.2 | 1.2 mm | 15.0 mm |
| 2026-04-07 | 24.9 | 13.4 | 1.2 mm | 16.4 mm |
| 2026-04-08 | 29.3 | 15.4 | 1.2 mm | 18.7 mm |
| 2026-04-09 | 34.8 | 17.4 | 1.2 mm | 21.1 mm |
| 2026-04-10 | 39.6 | 19.5 | 1.2 mm | 23.6 mm |
| 2026-04-11 | 44.9 | 21.3 | 1.2 mm | 27.2 mm |
| 2026-04-12 | 50.5 | 23.6 | 1.2 mm | 30.4 mm |
| 2026-04-13 | 56.2 | 25.8 | 10.4 mm | 32.7 mm |
| 2026-04-14 | 60.7 | 27.8 | 19.6 mm | 35.0 mm |
| 2026-04-15 | 66.9 | 30.1 | 19.8 mm | 36.8 mm |
| 2026-04-16 | 74.3 | 32.4 | 20.9 mm | 39.9 mm |
| 2026-04-17 | 82.3 | 34.9 | 21.0 mm | 43.2 mm |
| 2026-04-18 | 90.6 | 37.5 | 21.0 mm | 45.2 mm |
| 2026-04-19 | 97.2 | 40.2 | 21.4 mm | 47.6 mm |
| 2026-04-20 | 102.9 | 43.2 | 21.9 mm | 51.1 mm |
| 2026-04-21 | 109.0 | 46.6 | 26.7 mm | 54.1 mm |
| 2026-04-22 | 112.9 | 50.4 | 27.4 mm | 55.4 mm |
| 2026-04-23 | 116.0 | 54.1 | 27.4 mm | 57.6 mm |
| 2026-04-24 | 120.6 | 57.9 | 27.4 mm | 60.3 mm |
| 2026-04-25 | 125.8 | 62.1 | 27.4 mm | 62.3 mm |
| 2026-04-26 | 130.8 | 66.4 | 27.4 mm | 63.5 mm |
| 2026-04-27 | 137.2 | 70.9 | 27.4 mm | 67.2 mm |
| 2026-04-28 | 143.4 | 75.6 | 27.4 mm | 69.5 mm |
| 2026-04-29 | 149.8 | 80.1 | 27.5 mm | 71.7 mm |
| 2026-04-30 | 154.8 | 84.5 | 27.5 mm | 74.4 mm |
| 2026-05-01 | 158.6 | 89.6 | 27.5 mm | 77.0 mm |
| 2026-05-02 | 164.3 | 94.8 | 27.5 mm | 80.5 mm |
| 2026-05-03 | 169.7 | 100.4 | 27.5 mm | 83.6 mm |
| 2026-05-04 | 174.6 | 106.0 | 27.8 mm | 89.3 mm |
| 2026-05-05 | 180.2 | 111.2 | 44.9 mm | 93.1 mm |
| 2026-05-06 | 186.9 | 116.2 | 61.6 mm | 96.5 mm |
| 2026-05-07 | 193.2 | 121.4 | 65.3 mm | 98.7 mm |
| 2026-05-08 | 199.0 | 127.0 | 65.4 mm | 100.6 mm |
| 2026-05-09 | 206.6 | 132.7 | 65.5 mm | 103.5 mm |
| 2026-05-10 | 211.8 | 139.1 | 81.5 mm | 104.5 mm |
| 2026-05-11 | 218.9 | 145.8 | 84.9 mm | 106.2 mm |
| 2026-05-12 | 225.9 | 152.5 | 86.4 mm | 109.1 mm |
| 2026-05-13 | 230.5 | 159.1 | 87.1 mm | 110.9 mm |
| 2026-05-14 | 236.0 | 165.6 | 87.3 mm | 112.6 mm |
| 2026-05-15 | 239.2 | 171.7 | 102.0 mm | 115.0 mm |
| 2026-05-16 | 241.6 | 178.0 | 109.3 mm | 116.8 mm |
| 2026-05-17 | 245.9 | 184.8 | 109.3 mm | 118.7 mm |
| 2026-05-18 | 250.2 | 191.5 | 109.6 mm | 121.4 mm |
| 2026-05-19 | 255.3 | 198.1 | 110.4 mm | 123.6 mm |
| 2026-05-20 | 262.0 | 204.4 | 110.4 mm | 126.6 mm |
| 2026-05-21 | 271.2 | 211.3 | 110.4 mm | 128.4 mm |
| 2026-05-22 | 281.1 | 218.5 | 110.4 mm | 130.2 mm |
| 2026-05-23 | 291.4 | 226.2 | 110.4 mm | 131.7 mm |
| 2026-05-24 | 303.0 | 234.2 | 110.4 mm | 132.7 mm |
| 2026-05-25 | 316.2 | 242.4 | 110.4 mm | 133.3 mm |
| 2026-05-26 | 330.1 | 250.9 | 110.4 mm | 133.9 mm |
| 2026-05-27 | 344.7 | 259.4 | 110.4 mm | 135.1 mm |
| 2026-05-28 | 356.4 | 267.8 | 110.8 mm | 136.9 mm |
| 2026-05-29 | 369.2 | 275.9 | 111.7 mm | 139.1 mm |
| 2026-05-30 | 382.0 | 284.2 | 111.7 mm | 141.7 mm |
| 2026-05-31 | 394.1 | 292.5 | 111.8 mm | 143.0 mm |
| 2026-06-01 | 405.2 | 301.1 | 115.1 mm | 146.5 mm |
| 2026-06-02 | 417.2 | 310.0 | 115.3 mm | 149.0 mm |
| 2026-06-03 | 428.9 | 319.2 | 126.7 mm | 150.3 mm |
| 2026-06-04 | 440.1 | 328.4 | 126.7 mm | 151.6 mm |
| 2026-06-05 | 450.6 | 338.0 | 127.2 mm | 153.6 mm |
| 2026-06-06 | 460.2 | 347.3 | 127.2 mm | 155.2 mm |
| 2026-06-07 | 471.8 | 357.1 | 127.2 mm | 158.5 mm |
| 2026-06-08 | 483.7 | 367.2 | 127.2 mm | 160.8 mm |
| 2026-06-09 | 494.8 | 377.4 | 127.2 mm | 162.3 mm |
| 2026-06-10 | 506.3 | 387.8 | 127.4 mm | 163.6 mm |
| 2026-06-11 | 517.4 | 398.1 | 127.5 mm | 166.2 mm |
| 2026-06-12 | 528.4 | 408.1 | 127.5 mm | 168.8 mm |
| 2026-06-13 | 541.1 | 418.4 | 127.5 mm | 170.4 mm |
| 2026-06-14 | 552.5 | 428.6 | 127.5 mm | 172.8 mm |
| 2026-06-15 | 563.8 | 438.9 | 127.7 mm | 174.3 mm |
| 2026-06-16 | 577.2 | 449.9 | 127.9 mm | 175.5 mm |
| 2026-06-17 | 591.9 | 460.9 | 127.9 mm | 176.6 mm |
| 2026-06-18 | 607.9 | 472.3 | 127.9 mm | 177.1 mm |
| 2026-06-19 | 625.4 | 483.8 | 128.2 mm | 178.8 mm |
| 2026-06-20 | 643.3 | 495.3 | 128.2 mm | 180.4 mm |
| 2026-06-21 | 660.7 | 506.6 | 128.3 mm | 181.3 mm |
| 2026-06-22 | 678.8 | 518.4 | 128.7 mm | 182.0 mm |
| 2026-06-23 | 697.1 | 530.2 | 129.2 mm | 183.2 mm |
| 2026-06-24 | 715.0 | 542.1 | 130.8 mm | 184.0 mm |
| 2026-06-25 | 732.5 | 554.3 | 132.8 mm | 184.8 mm |
| 2026-06-26 | 750.0 | 566.6 | 132.8 mm | 185.3 mm |
| 2026-06-27 | 768.5 | 579.2 | 132.8 mm | 185.8 mm |
| 2026-06-28 | 787.2 | 591.8 | 132.8 mm | 187.4 mm |
| 2026-06-29 | 806.3 | 604.6 | 135.0 mm | 188.0 mm |
| 2026-06-30 | 823.6 | 617.5 | 136.2 mm | 189.0 mm |
| 2026-07-01 | 840.7 | 630.7 | 139.5 mm | 189.2 mm |
| 2026-07-02 | 854.1 | 643.9 | 147.4 mm | 189.6 mm |
| 2026-07-03 | 869.8 | 657.4 | 147.4 mm | 190.1 mm |
| 2026-07-04 | 885.7 | 671.1 | 147.4 mm | 190.5 mm |
| 2026-07-05 | 901.9 | 684.4 | 147.7 mm | 192.1 mm |
| 2026-07-06 | 917.5 | 697.8 | 147.9 mm | 193.0 mm |
| 2026-07-07 | 933.4 | 711.1 | 147.9 mm | 193.9 mm |
| 2026-07-08 | 948.3 | 724.3 | 147.9 mm | 194.5 mm |
| 2026-07-09 | 965.3 | 737.4 | 147.9 mm | 194.9 mm |
| 2026-07-10 | 982.4 | 750.2 | 148.0 mm | 195.6 mm |
| 2026-07-11 | 998.8 | 763.0 | 148.0 mm | 196.6 mm |
| 2026-07-12 | 1016.0 | 776.0 | 148.0 mm | 197.2 mm |
| 2026-07-13 | 1034.0 | 789.1 | 148.0 mm | 197.8 mm |
| 2026-07-14 | 1052.0 | 802.2 | 148.0 mm | 198.8 mm |
| 2026-07-15 | 1070.3 | 815.4 | 148.0 mm | 200.1 mm |
| 2026-07-16 | 1089.1 | 828.7 | 148.2 mm | 200.9 mm |
| 2026-07-17 | 1108.3 | 842.1 | 148.2 mm | 201.3 mm |
| 2026-07-18 | 1126.8 | 855.8 | 148.2 mm | 201.8 mm |
| 2026-07-19 | 1144.9 | 869.6 | 148.2 mm | 202.5 mm |
| 2026-07-20 | 1163.1 | 883.5 | 148.2 mm | 204.2 mm |
| 2026-07-21 | 1181.3 | 897.2 | 149.3 mm | 204.9 mm |
| 2026-07-22 | 1197.2 | 911.4 | 149.3 mm | 205.5 mm |
| 2026-07-23 | 1212.7 | 925.9 | 149.4 mm | 205.8 mm |
| 2026-07-24 | 1227.5 | 940.3 | 149.4 mm | 206.6 mm |
| 2026-07-25 | 1242.4 | 954.4 | 149.4 mm | 208.1 mm |
| 2026-07-26 | 1257.6 | 968.5 | 177.2 mm | 208.6 mm |
| 2026-07-27 | 1273.3 | 982.9 | 177.2 mm | 210.1 mm |
| 2026-07-28 | 1291.1 | 997.2 | 177.2 mm | 211.8 mm |
| 2026-07-29 | 1309.7 | 1011.5 | 177.2 mm | 214.4 mm |
| 2026-07-30 | 1328.7 | 1025.8 | 177.2 mm | 216.7 mm |
| 2026-07-31 | 1348.0 | 1040.1 | 177.2 mm | 218.9 mm |
| 2026-08-01 | 1366.6 | 1054.7 | 177.3 mm | 219.4 mm |
| 2026-08-02 | 1385.1 | 1069.5 | 177.3 mm | 219.5 mm |
| 2026-08-03 | 1404.0 | 1084.3 | 177.3 mm | 220.2 mm |
| 2026-08-04 | 1423.0 | 1099.0 | 177.3 mm | 220.8 mm |
| 2026-08-05 | 1441.6 | 1113.5 | 177.6 mm | 222.4 mm |
| 2026-08-06 | 1460.3 | 1128.0 | 177.7 mm | 223.1 mm |
| 2026-08-07 | 1479.0 | 1142.8 | 177.7 mm | 223.3 mm |
| 2026-08-08 | 1497.6 | 1157.5 | 177.7 mm | 224.3 mm |
| 2026-08-09 | 1516.5 | 1171.9 | 177.8 mm | 225.3 mm |
| 2026-08-10 | 1535.5 | 1186.1 | 177.8 mm | 227.6 mm |
| 2026-08-11 | 1554.6 | 1200.1 | 178.2 mm | 229.6 mm |
| 2026-08-12 | 1574.3 | 1213.7 | 179.1 mm | 230.5 mm |
| 2026-08-13 | 1593.3 | 1227.5 | 179.1 mm | 232.1 mm |
| 2026-08-14 | 1612.5 | 1241.2 | 179.1 mm | 233.7 mm |
| 2026-08-15 | 1631.3 | 1254.9 | 179.1 mm | 234.9 mm |
| 2026-08-16 | 1648.3 | 1268.6 | 181.9 mm | 235.6 mm |
| 2026-08-17 | 1662.5 | 1282.3 | 185.1 mm | 235.9 mm |
| 2026-08-18 | 1678.1 | 1296.3 | 185.1 mm | 236.6 mm |
| 2026-08-19 | 1694.6 | 1310.3 | 185.1 mm | 237.2 mm |
| 2026-08-20 | 1712.2 | 1324.5 | 191.0 mm | 238.1 mm |
| 2026-08-21 | 1726.8 | 1338.5 | 202.5 mm | 239.0 mm |
| 2026-08-22 | 1741.7 | 1352.2 | 202.6 mm | 239.9 mm |
| 2026-08-23 | 1756.5 | 1365.9 | 202.6 mm | 241.2 mm |
| 2026-08-24 | 1772.8 | 1379.5 | 202.6 mm | 243.7 mm |
| 2026-08-25 | 1786.8 | 1393.4 | 206.4 mm | 247.1 mm |
| 2026-08-26 | 1802.5 | 1407.1 | 206.5 mm | 248.4 mm |
| 2026-08-27 | 1820.0 | 1420.6 | 206.5 mm | 249.5 mm |
| 2026-08-28 | 1839.2 | 1433.6 | 206.5 mm | 252.0 mm |
| 2026-08-29 | 1856.2 | 1446.6 | 206.6 mm | 253.3 mm |
| 2026-08-30 | 1871.7 | 1459.2 | 206.7 mm | 255.3 mm |
| 2026-08-31 | 1886.3 | 1471.0 | 206.7 mm | 258.1 mm |
| 2026-09-01 | 1902.0 | 1482.3 | 206.7 mm | 259.7 mm |
| 2026-09-02 | 1916.7 | 1493.5 | 206.7 mm | 261.6 mm |
| 2026-09-03 | 1932.3 | 1504.9 | 206.7 mm | 262.9 mm |
| 2026-09-04 | 1949.7 | 1516.1 | 206.7 mm | 265.7 mm |
| 2026-09-05 | 1965.2 | 1527.2 | 206.7 mm | 266.9 mm |
| 2026-09-06 | 1982.1 | 1537.9 | 206.7 mm | 267.5 mm |
| 2026-09-07 | 2000.1 | 1548.7 | 206.7 mm | 268.9 mm |
| 2026-09-08 | 2016.4 | 1559.6 | 207.1 mm | 271.3 mm |
| 2026-09-09 | 2030.8 | 1570.6 | 221.1 mm | 273.6 mm |
| 2026-09-10 | 2041.7 | 1581.2 | 249.9 mm | 277.3 mm |
| 2026-09-11 | 2053.8 | 1592.0 | 250.9 mm | 279.7 mm |
| 2026-09-12 | 2065.6 | 1602.6 | 251.0 mm | 283.0 mm |
| 2026-09-13 | 2077.6 | 1612.8 | 251.0 mm | 286.9 mm |
| 2026-09-14 | 2090.0 | 1622.6 | 251.0 mm | 292.7 mm |
| 2026-09-15 | 2102.7 | 1632.3 | 251.0 mm | 295.7 mm |
| 2026-09-16 | 2114.8 | 1642.0 | 251.0 mm | 301.5 mm |
| 2026-09-17 | 2127.3 | 1651.8 | 259.4 mm | 304.9 mm |
| 2026-09-18 | 2138.5 | 1661.2 | 270.0 mm | 308.7 mm |
| 2026-09-19 | 2150.1 | 1670.4 | 270.4 mm | 312.1 mm |
| 2026-09-20 | 2162.0 | 1679.5 | 270.4 mm | 316.2 mm |
| 2026-09-21 | 2174.4 | 1688.4 | 270.4 mm | 319.5 mm |
| 2026-09-22 | 2185.8 | 1697.5 | 270.4 mm | 322.2 mm |
| 2026-09-23 | 2194.5 | 1706.2 | 270.4 mm | 329.3 mm |
| 2026-09-24 | 2202.9 | 1714.8 | 270.6 mm | 332.9 mm |
| 2026-09-25 | 2212.6 | 1722.7 | 270.7 mm | 336.4 mm |
| 2026-09-26 | 2221.3 | 1730.5 | 270.7 mm | 338.5 mm |
| 2026-09-27 | 2231.0 | 1738.1 | 270.7 mm | 342.0 mm |
| 2026-09-28 | 2241.2 | 1745.6 | 270.7 mm | 344.4 mm |
| 2026-09-29 | 2251.8 | 1752.9 | 270.7 mm | 346.7 mm |
| 2026-09-30 | 2262.4 | 1760.2 | 270.7 mm | 350.8 mm |
| 2026-10-01 | 2272.8 | 1767.8 | 270.7 mm | 356.1 mm |
| 2026-10-02 | 2284.2 | 1775.6 | 270.7 mm | 360.4 mm |
| 2026-10-03 | 2294.2 | 1783.0 | 270.7 mm | 363.8 mm |
| 2026-10-04 | 2304.2 | 1790.2 | 270.8 mm | 366.8 mm |
| 2026-10-05 | 2312.8 | 1797.3 | 272.6 mm | 371.2 mm |
| 2026-10-06 | 2321.7 | 1804.0 | 277.4 mm | 374.4 mm |
| 2026-10-07 | 2329.8 | 1810.6 | 286.0 mm | 380.2 mm |
| 2026-10-08 | 2339.5 | 1816.9 | 310.2 mm | 383.1 mm |
| 2026-10-09 | 2347.5 | 1823.3 | 313.3 mm | 384.3 mm |
| 2026-10-10 | 2353.5 | 1829.6 | 313.7 mm | 389.4 mm |
| 2026-10-11 | 2361.1 | 1835.9 | 313.7 mm | 392.0 mm |
| 2026-10-12 | 2368.7 | 1842.1 | 314.2 mm | 395.3 mm |
| 2026-10-13 | 2374.2 | 1848.2 | 314.2 mm | 397.1 mm |
| 2026-10-14 | 2380.5 | 1854.0 | 314.2 mm | 401.9 mm |
| 2026-10-15 | 2387.8 | 1859.2 | 314.2 mm | 407.2 mm |
| 2026-10-16 | 2395.8 | 1864.3 | 314.2 mm | 409.7 mm |
| 2026-10-17 | 2403.5 | 1869.4 | 314.2 mm | 413.0 mm |
| 2026-10-18 | 2410.9 | 1874.1 | 315.7 mm | 415.9 mm |
| 2026-10-19 | 2419.3 | 1878.8 | 316.0 mm | 418.6 mm |
Forecast outlook
ECMWF IFS 0.25° via Herbie · run Oct 30, 2026 at 00:00 UTC
10-day totals compared with the 1991–2020 combined regional record
- GDD accumulation
- 2 GDDvs 33 GDD average
- Total rainfall
- 0.5 mmvs 49.0 mm average
No unusually hot or wet period stands out in the short-range forecast.
Fri10/30
18°Cavg 17°C
7°Cavg 10°C
+1 GDD
0.0 mm
Sat10/31
17°Cavg 17°C
6°Cavg 10°C
+0 GDD
0.0 mm
Sun11/1
12°Cavg 17°C
5°Cavg 10°C
+0 GDD
0.0 mm
Mon11/2
12°Cavg 17°C
6°Cavg 10°C
+0 GDD
0.0 mm
Tue11/3
15°Cavg 17°C
6°Cavg 10°C
+0 GDD
0.0 mm
Wed11/4
15°Cavg 17°C
5°Cavg 10°C
+0 GDD
0.0 mm
Thu11/5
15°Cavg 17°C
6°Cavg 10°C
+0 GDD
0.0 mm
Fri11/6
14°Cavg 16°C
5°Cavg 9°C
+0 GDD
0.0 mm
Sat11/7
12°Cavg 15°C
5°Cavg 9°C
+0 GDD
0.5 mm
Sun11/8
15°Cavg 15°C
5°Cavg 8°C
+0 GDD
0.0 mm
Data and methods
Show data sources and model assumptions
Current model conditions and the 10-day outlook use the 00 UTC deterministic ECMWF IFS 0.25° public forecast retrieved directly with Herbie. Historical temperature and rain combine qualifying GHCN-D stations with ERA5 by geographic area; a missing station day uses the nearest ERA5 value for that station's area. Climate comparisons use 1991–2020.
Forecast comparisons use the 1991–2020 combined regional daily record. Daily high and low averages use the matching date; rainfall and GDD sum the same calendar dates as the forecast period.
This service is based on data and products of the European Centre for Medium-Range Weather Forecasts (ECMWF). Weather & Vines subsets, converts, and regionally weights the forecast fields. ECMWF data are published under CC BY 4.0. ECMWF accepts no liability for errors, omissions, availability, loss, or damage arising from their use.
Climate projections use NASA NEX-GDDP-CMIP6 v2.0, accessed September 20, 2026, with 25 models. Weather & Vines subsets and aggregates the source fields. Source files and derived projection data are under CC BY-SA 4.0; the full roster and limitations are listed in the climate atlas methods.
Region outline: Istituto nazionale di statistica (Istat), 2026; reprojected and simplified by Weather & Vines; CC BY 4.0. This is a statistical administrative boundary, not a wine-denomination boundary.
The Tuscany model uses a April 1–October 31 growing season, base 10°C GDD, and an operational hot-day marker of 35°C.